
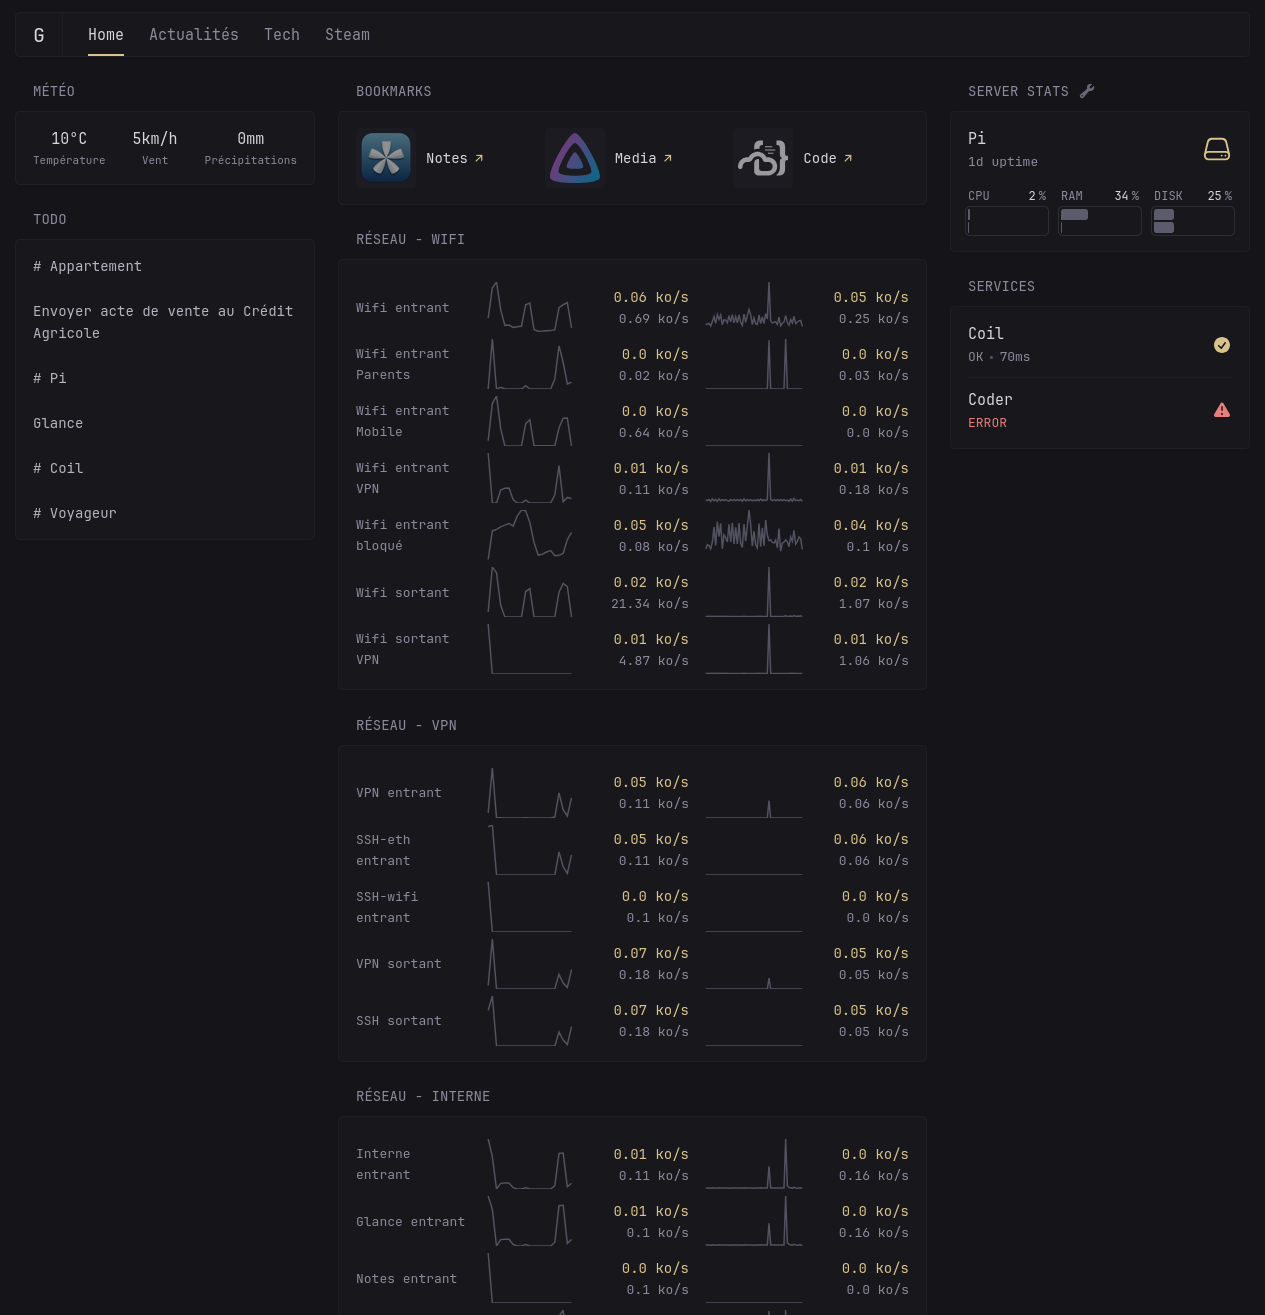
I spent some time learning and configuring my firewall, then displayed it in form of SVG graph on Glance. I’m pretty happy about the result so I wanted to share it :)
I spent some time learning and configuring my firewall, then displayed it in form of SVG graph on Glance. I’m pretty happy about the result so I wanted to share it :)
That’s one I haven’t tried. I’ve probably tried most of the other dashboard offerings and decided to go with Homarr. I do like the monitoring aspect of Glance, tho I use NetData for that kind of monitoring. But yeah bro, looks great!
What’s your thought of homepage?
I liked Homepage. Very customizable, very well presented package and the UI is nice. I know, if you are running the *arr stack, it does a lot of interfacing with those apps. Not exclusively the *arr stack as it can interface with ProxMox to show how many VMs you’re running and load/CPU etc.
Name is silly. How does one go about finding the homepage for Homepage?
I agree it’s a bad name. Here is the link https://gethomepage.dev/
It’s pretty bad. That said, I search for “gethomepage” and find it every time.
Glance is cool I love the style and it is well implemented so you can easily add custom HTML and CSS which is what I did to do this custom monitoring. Data are gathered from iptables counters that periodically reset, the hardest and most interesting part was to understand networking and to track packet through applications based on if they were port binded or reverse proxyed (I use Caddy for web facing app I want access to without a VPN). I’ll definitively check more advanced solution, I just needed to do it manually first to actually understand what I’m doing (which took me like 2 weeks until I finally found this gem on ArchLinux wiki https://www.frozentux.net/iptables-tutorial/iptables-tutorial.html)
Do you have persistent IPtables then?Yes, reading comprehension on my part. Doh!
Yes the full recipe is: